Input dispatch
The system waits about 5 seconds for the app to respond to a key or touch event before that alone can trigger an ANR — the most common cause reported in the field.
Guide / Android ANR
Android ANR log analysis starts in one place: the ActivityManager: ANR in <package> line logcat writes when the system gives up waiting on the app. This guide covers what triggers an ANR, where the supporting evidence lives, a repeatable method for reading it, and how Indagium works as an ANR log analyzer once the file is open.
The timeout clock
"Application Not Responding" is Android's way of saying a specific timeout expired while the app's main thread was busy with something else. Which timeout fired is part of the evidence, not just the headline.
The system waits about 5 seconds for the app to respond to a key or touch event before that alone can trigger an ANR — the most common cause reported in the field.
A BroadcastReceiver.onReceive() that blocks past its execution window — a shorter window when the app is in the foreground — produces an ANR tagged with the broadcast's action.
A service that doesn't finish its startup work in time, again under a shorter foreground window, produces an ANR naming the service class.
A ContentProvider that blocks while publishing itself during app startup can also trigger an ANR, though it's rarer than the other three.
The evidence trail
Logcat gives you the alarm; the thread dump gives you the explanation. Reading an ANR means moving between the two.
The first clue is the line ActivityManager writes to logcat at the moment of the timeout: ANR in <package>, followed by a Reason: field naming the timeout and a timestamp you can anchor on. ActivityManager typically follows it with a block of CPU usage lines — per-process and per-thread load over the preceding window — which is often the fastest way to see whether the device was simply overloaded.
The full picture is a thread dump. Pull one with adb bugreport bugreport.zip, or use a bug report a device already saved, and look under /data/anr/ — a single traces.txt file on older Android versions, or separate per-process trace files on newer ones. Logcat tells you an ANR happened; the trace file tells you which thread the main thread was actually blocked on.
A repeatable method
Search or filter the logcat for ANR in from the ActivityManager tag. This is your anchor timestamp for everything that follows.
The Reason: field tells you which timeout fired — input dispatch, a broadcast, a service, or a content provider — before you go looking for a cause.
Scroll or filter to what the main thread logged in the seconds leading up to the timeout. A long gap between two adjacent lines is often the stall itself.
In the trace file, find the thread named main and read its state. BLOCKED names the lock and the thread holding it; WAITING points at the call it's stuck in.
Cross-reference nearby garbage-collection pauses, binder transactions, or disk and network waits that line up with the stall — the blocking call is rarely the whole story.
From clue to explanation
Start from the bug report itself: drop the .zip or .7z and Indagium scans it for log candidates — including ANR traces — before you filter anything.
Indagium recognises ActivityManager ANR messages and groups them into a jumpable ANR category alongside crashes and exceptions — nothing to configure first.
Stack traces fold automatically, so a long thread dump collapses to a header you expand only when you need the frames.
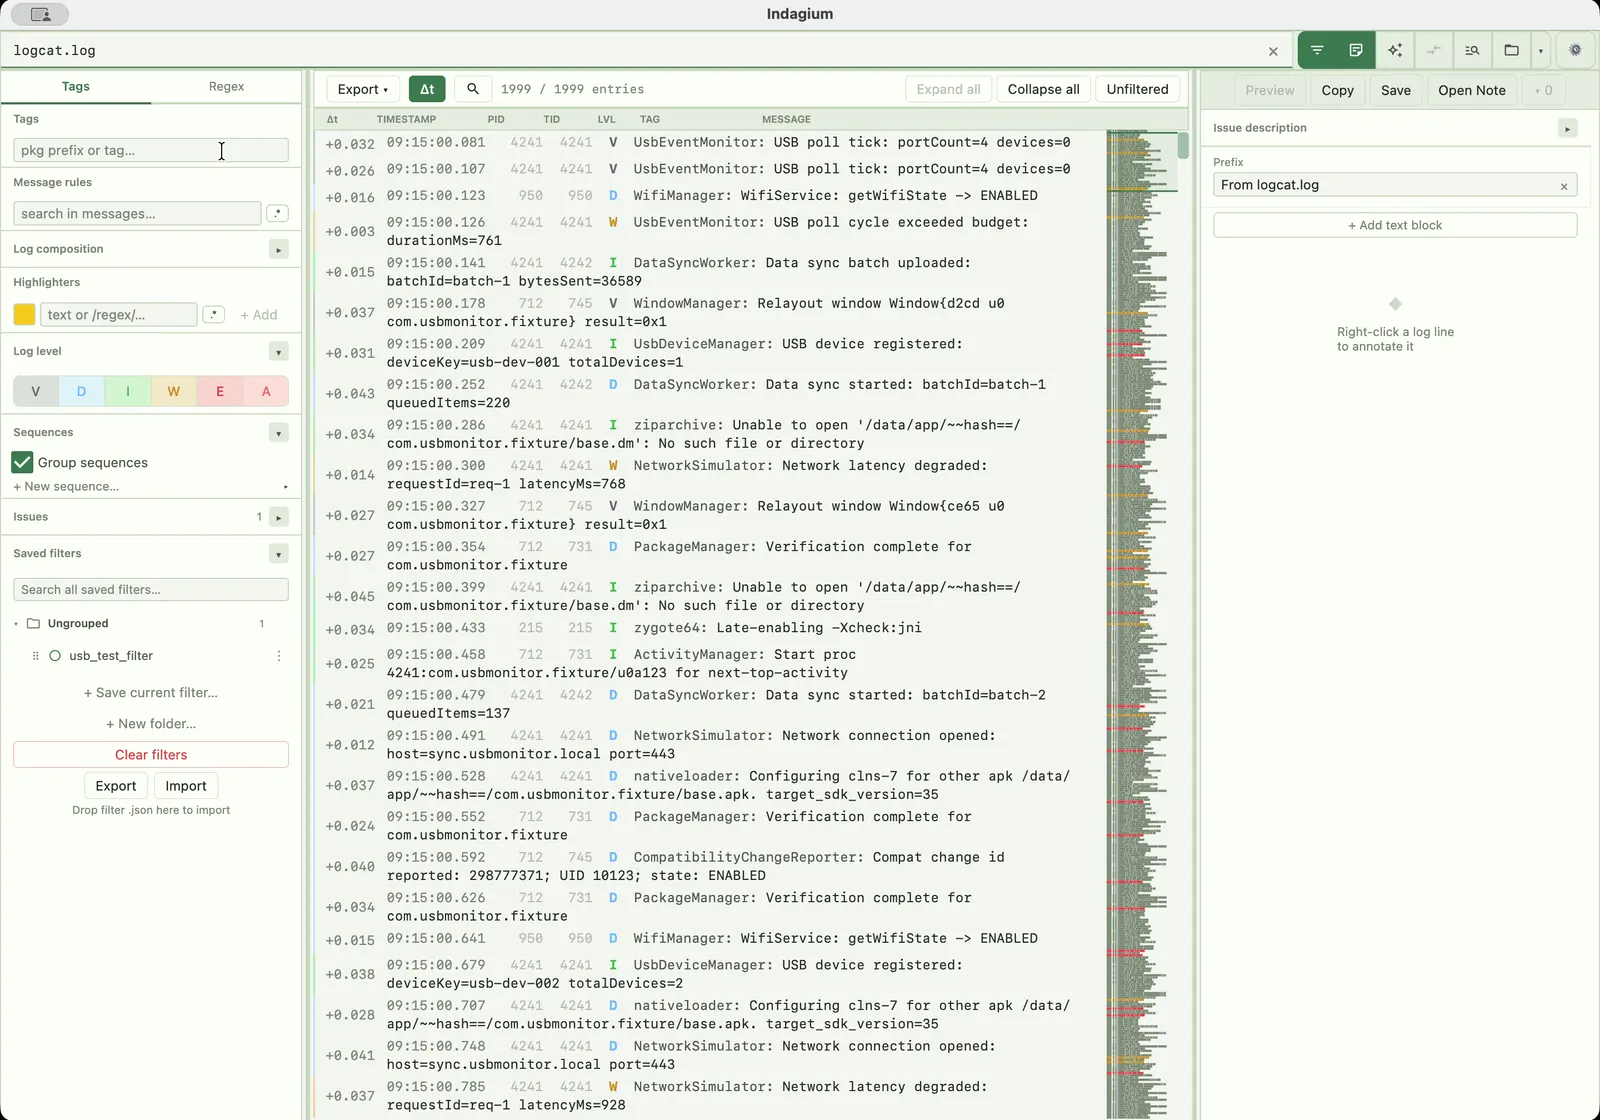
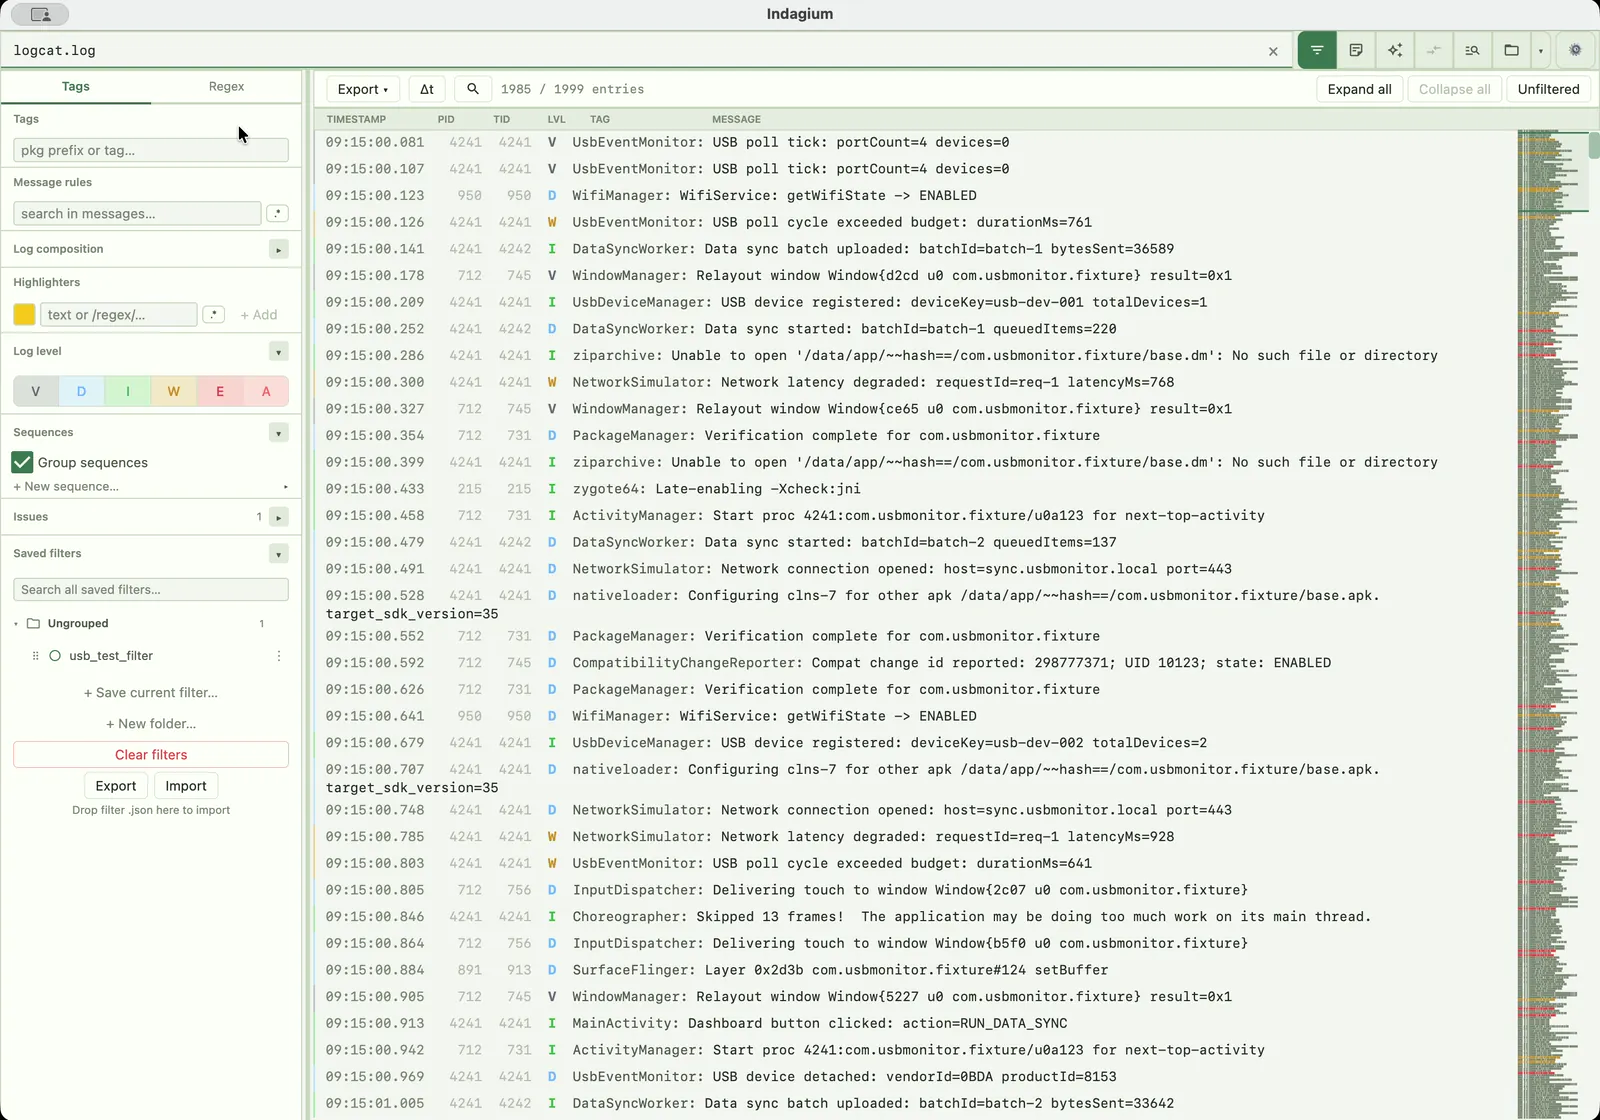
Turn on Δt in the log toolbar to see the gap between adjacent rows, or the offset from a selected anchor — the fastest way to spot the stall before the ANR fires.
Right-click a row and choose Threads: Show map to colour every thread in that process and see interleaved activity in a branch gutter beside the log.
The PID/TID box narrows the log to the exact process and thread named in the trace, so you can watch just the main thread's timeline.
Open two tabs side by side to compare a healthy run against the one that ANR'd, then annotate the finding and export it as Markdown or Jira markup.
Common questions
The Reason: on the ActivityManager: ANR in <package> line names which timeout fired — for example "Input dispatching timed out", or a broadcast or service description — so you know which of the ANR triggers to investigate first.
Under /data/anr/ — a single traces.txt file on older Android versions, or separate per-process trace files on newer ones. Indagium's bug-report picker surfaces them as log candidates when you open the .zip or .7z.
No. Indagium opens files you've already captured — with adb logcat -d > log.txt, adb bugreport bugreport.zip, or a device's saved bug report — it does not talk to adb itself.
In the trace file, find the thread named main and read its state. A BLOCKED state names the lock and the thread holding it ("held by thread …"); a WAITING state points at the call it's stuck in.
Yes — Indagium is free to use and source-available under the PolyForm Perimeter license. Download it for macOS, Windows, or Linux from the GitHub releases page.
Keep going